Speaker
Description
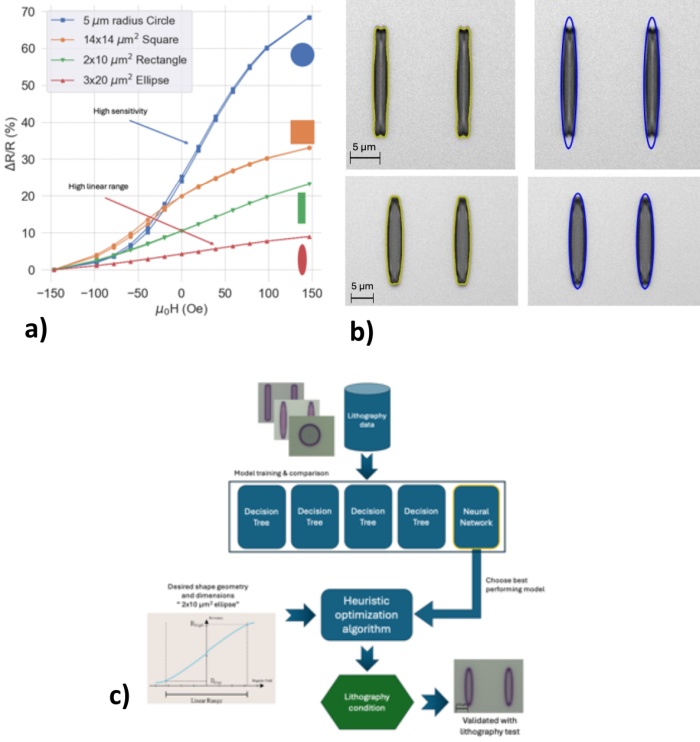
When designing a magnetic tunnel junction (MTJ) sensor, Key Performance Indicators (KPIs) such as sensitivity, linear operating field range and electrical resistance are set by the application specifications. One of the critical design parameters to tune is the geometry of the MTJ device, as shape, dimension, and aspect ratio directly impact KPIs [1]. By choosing the geometry of the device, it is possible to fit its operation method to the purpose of the sensor (e.g. high linear range vs. high sensitivity applications) (Fig. 1a). For the patterning of MTJ’s in an industrial setting, mask aligner lithography serves as a cost effective technique for increased throughput and resolution up to 1 $\mu$m. However due to the nature of shadow printing, mask aligner lithography is prone to undesired effects such as dark erosion. This leads to different shape geometry and dimensions having varying optimal lithography conditions (Fig. 1b). Therefore there is a need of determining the optimal conditions when patterning a new shape and having a tailored response on demand.
In this research several machine learning models were trained with data from 35 lithography tests comprising different shapes and patterned with diverse conditions, to ultimately predict the dimensions and the quality of the patterned shape. The quality was defined as the proportion of area affected by dark erosion to the desired shape. To compare the models’ performance two metrics were used, root mean squared error (RMSE) (for normalized data) and the correlation of determination (R2) for each of the outputs of the models. The best performing models obtained were a Gradient Boosted Tree (GBT) with an average RMSE of 0.19 and an average R$^2$ of 0.86, and a Neural Network (NN) with an RMSE of 0.21 and an R$^2$ of 0.81. While the NN performs worse than the GBT model, the NN was chosen for the inverse analysis due to the nature of GBT, as it finds several conditions leading to the same output, hindering the performance of heuristic optimization algorithms during the inverse search.
Once the best performing model was chosen, inverse analysis was performed with the use of heuristic optimization algorithms such as differential evolution, genetic algorithm, and particle swarm optimization, allowing for the prediction of the optimal lithography conditions to obtain a certain pattern. The structure of the model is shown in Fig. 1c. Obtained predictions were compared with the prediction from the GBT model and if both models were in accordance the conditions were then validated with experimental tests.

Fig. 1 a) Transfer curves from 4 MTJ devices with different shapes and same magnetic stack. b) Top: 2$\times$20 $\mu$m ellipse with significant dark erosion. Bottom: 3$\times$20 ellipse with reduced dark erosion. Exposed with same conditions. c) Model structure.
References
[1] A. V. Silva, D. C. Leitao, J. Valadeiro, J. Amaral, P. P. Freitas, and S. Cardoso, “Linearization strategies for high sensitivity magnetoresistive sensors,” The European Physical Journal Applied Physics, vol. 72, no. 1. EDP Sciences, p. 10601, Oct. 2015. doi: 10.1051/epjap/2015150214.

