Speaker
Description
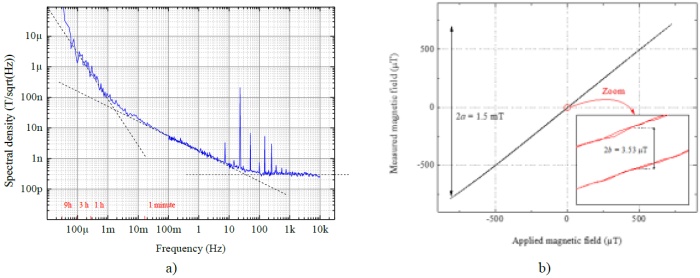
Classically, the ultimate or intrinsic noise of a sensor is studied/given by the help of the Fluctuation Dissipation Theorem (FDT). Here, we have investigated the magnetic noise of the Planar Hall MagnetoResistance (PHMR) sensor [1] based on this phenomenological physical description [2] and experimental measurements. Indeed, the ellipse surface given by the sensor response, lying $B$ (sensed induction) versus $H$ applied magnetic field, is homogenous of an energy taking account of the magnetic material sensor volume. It helps to quantify the dissipation, so losses. In a parallel way, we have measured the sensor response versus the applied field to evaluate the equivalent magnetic noise in terms of spectral density. The latter have been compared to classical noise spectral density measurements. Result yields to fix the ultimate noise of the sensor based on the given sensor development and quantified the dominant sources versus bias conditions and frequency range, clearly. The physics underlying the experimental results is shown to be consistent, up to a certain extent, with the FDT. It yields
$S_{BB}\approx \frac{2k_{B}T}{\Omega\pi f} \frac{B_{sat}}{M_{S}}\left(\frac{\chi''(f)}{\chi'}\right) + 4k_{B}TR\left(\frac{R}{\Delta R}\frac{B_{sat}}{V_{0}} \right)^2 + kS_{TT}(f) \quad \mathrm{[T^2/Hz]}$
where $S_{BB}$, $k_{B}$, $T$, $B_{sat}$, $f$, $M_{S}$, $\chi$, $R$, $\Delta R/R$, $V_{0}$, $k$ and $S_{TT}$ are the equivalent magnetic noise power spectral density, the vacuum permeability, the temperature, the saturate induction field of free hard axis layer, the frequency, the saturation magnetization of the free layer (permalloy), the loss terms (real and imaginary parts), the bridge resistance, the magnetoresistance coefficient, the bias voltage of the bridge, a factor in units of T/K and the power spectral density of the environmental temperature fluctuations, respectively.

Fig. 1 (a) Equivalent magnetic noise spectral density measurement of a PHMR sensor (The peak signal at 23 Hz is a reference, others peaks are induced by the power line). The dashed lines correspond to evaluate noise based on modeling and hypotheses. (b) Example of a measured ellipse (equivalent sensed induction field versus applied magnetic field @ 0.03 Hz) used to extract $\chi'$ and $\chi''$ values.
References
[1] B. Lim et al., “Advances and key technologies in magnetoresistive sensors with high thermal stabilities and low field detectivities,” APL Materials, vol. 10, no. 5. AIP Publishing, May 01, 2022. doi: 10.1063/5.0087311.
[2] N. Smith and P. Arnett, “White-noise magnetization fluctuations in magnetoresistive heads,” Applied Physics Letters, vol. 78, no. 10. AIP Publishing, pp. 1448–1450, Mar. 05, 2001. doi: 10.1063/1.1352694.

